Describing complex issues
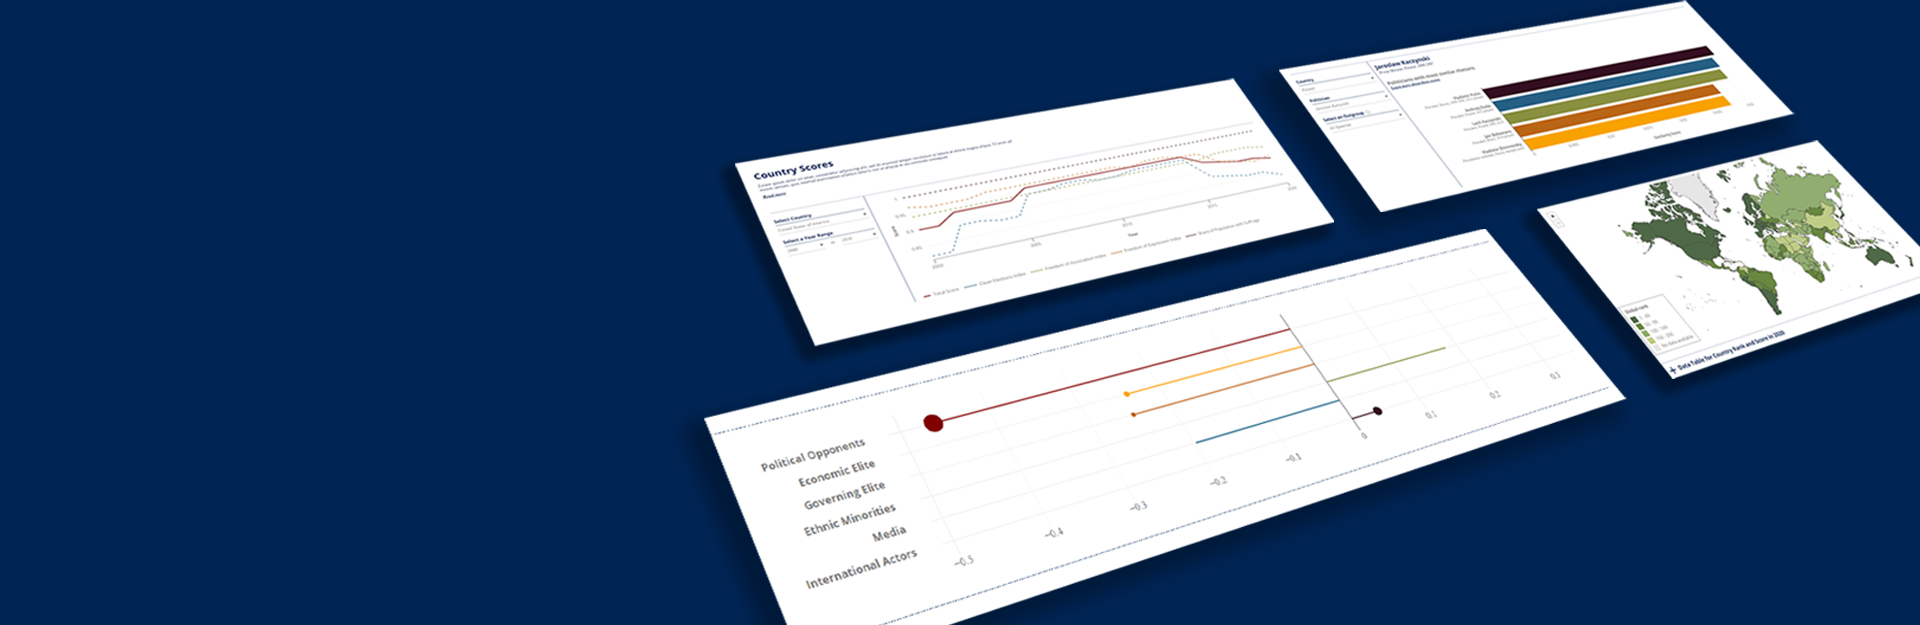
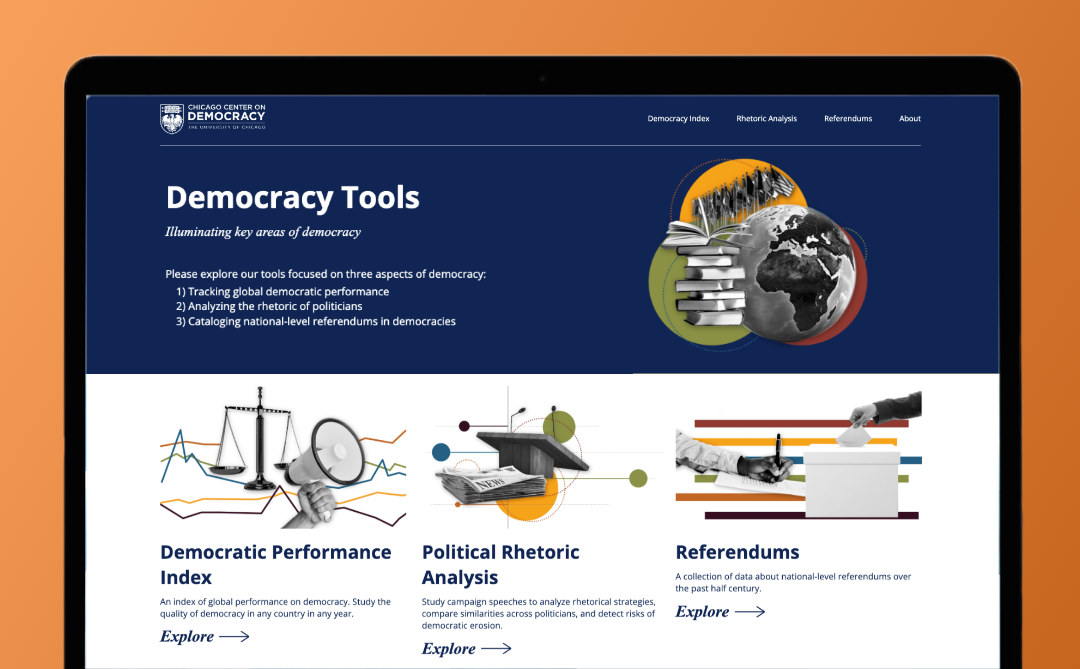
How can you connect research on global democratic performance, political rhetoric, and referendums with a wide audience? The Democracy Tools dashboard uses interactive data visualisation to describe complex issues, study them further, and communicate about them to strengthen democracy around the world.
Measuring Democracy
We worked with the Chicago Center of Democracy to help visualise their work to strengthen democracy through research, discussion, and community-building. The Democracy Tools dashboard showcases their data and analyses in easy-to-understand visualisations through three dedicated topical modules.
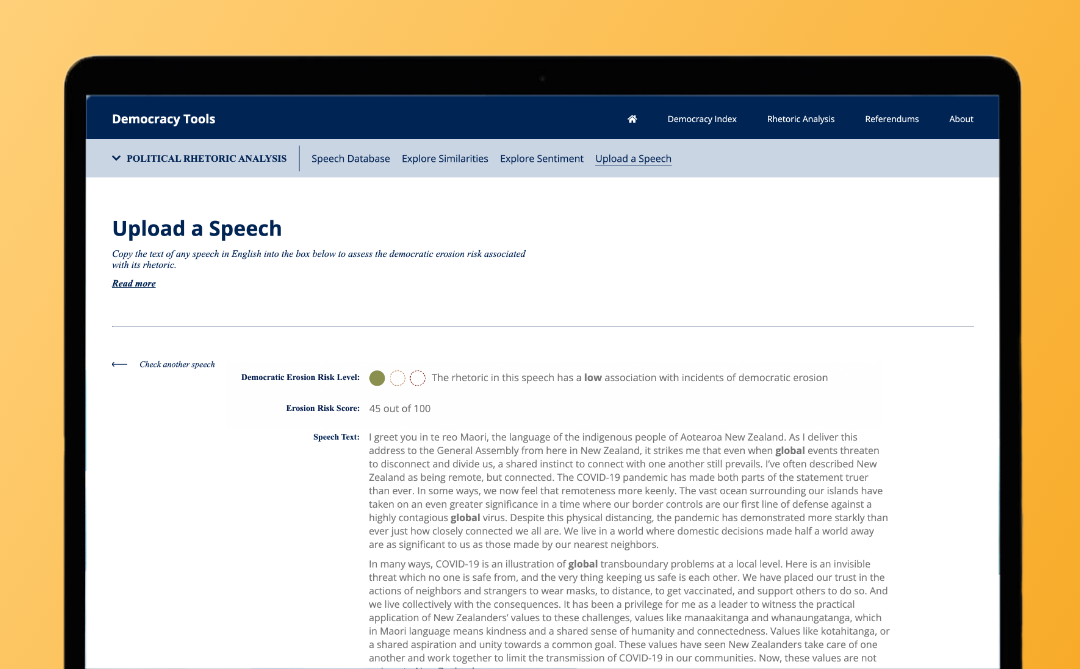
Broadening the scope of interactivity
The upload a speech module elevates the scope of the dashboard. It gives users the freedom to upload a speech of their own choosing to assess its democratic erosion score. The feature pinpoints terms used within the speech and cross references them against keywords associated with low, medium and high levels of democratic erosion.
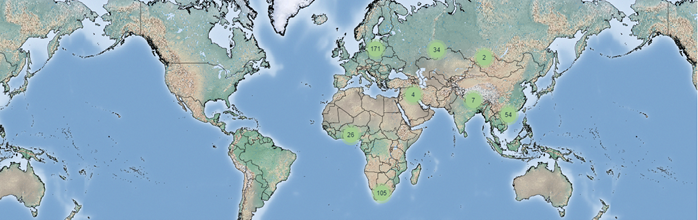
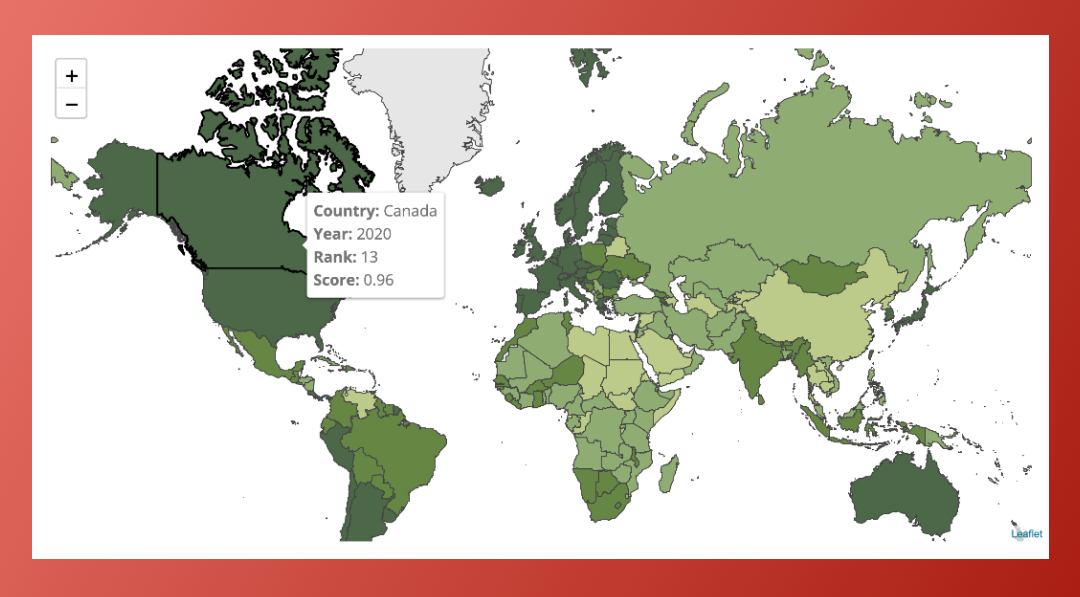
Mapping democracy over time
A key feature of the application allows user to explore democratic performance for different countries and different years dating over 200 years back from today.
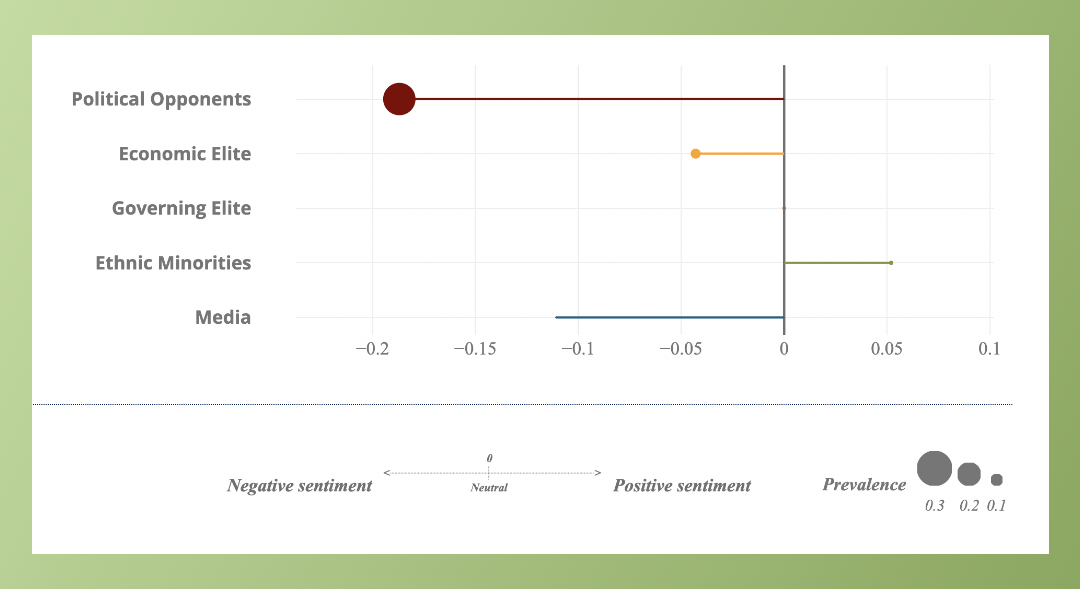
Comparing speech sentiments
Users can also explore speech sentiments of different politicians towards specific group, such as ethnic minorities. In addition it is possible to compare different politicians against each other.